
See and change Claude Code's telemetry settings
To see what Claude Code is set to send, open Telemetry Radar (Beta) from the stripe on the right in ccdeck and click Configuration: it lists the telemetry destinations and flags in Claude Code's settings files, with a switch for each flag your user settings set.
You will
- See which telemetry flags and destinations Claude Code’s settings set
- Switch a flag for new sessions
- Watch what reaches your collector, and know what Radar cannot see
Before you start
- ccdeck running, in your browser or the desktop app:
npx ccdeck. - Claude Code on the same machine: Radar reads its settings and watches its connections.
Steps
-
Open Telemetry Radar
Click the Telemetry Radar icon on the stripe on the right, below Browser Watch’s eye. It has no key. On a phone, it is under More in the dock along the bottom. The dialog is marked Beta.
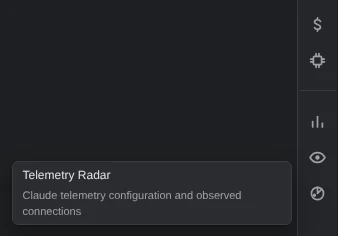
Demo data Hover an icon to see its name. -
Read what Claude Code is set to send
Click Configuration. Destinations lists where the export goes. Under Telemetry and content, each flag a settings file sets has its name, its variable and the file it came from: Your prompts is
OTEL_LOG_USER_PROMPTS, for one.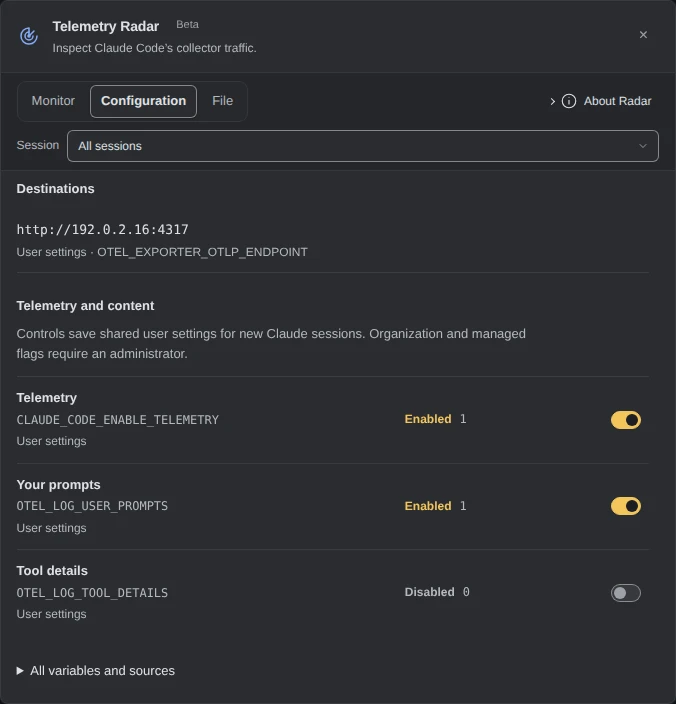
Demo data Telemetry and prompts on, tool details off, all in your own settings. Settings, not sessions. Radar reads files. A session started before a change keeps what it loaded, and a variable set only in your shell does not show. “No destination found” does not mean telemetry is off.
More about what Radar reads
- The
envblock of three files:~/.claude/settings.json(underCLAUDE_CONFIG_DIRwhen that is set), the cached organization settings beside it,remote-settings.json, and the managed settings file,managed-settings.jsonin/Library/Application Support/ClaudeCode/on macOS,/etc/claude-code/on Linux orC:\Program Files\ClaudeCode\on Windows. - Not a project’s
.claude/settings.json. - A destination shows without its path, and headers as “Configured (hidden)”.
- All variables and sources lists every variable read, and whether each file was found.
- With no destination set, Radar lists the connections Claude Code has open. A connection is not telemetry.
- The
-
Switch a flag for new sessions
Click the switch beside the flag. Radar writes
"1"or"0"for it underenvin~/.claude/settings.jsonand says Saved to user settings. Sessions already running keep the value they started with.Radar switches only flags a settings file already sets; it adds none. A flag your organization or managed settings set shows Managed: only an administrator can change it. A value Radar cannot read gets Enable and Disable buttons instead.
Switching off writes “0”, and it outlasts ccdeck.
npx ccdeck --uninstallleaves it in place. To remove it, editenvin the file. -
Start monitoring your collector
Click Monitor, pick the destination, then click Start monitoring. ccdeck runs the capture itself: nothing to paste into a terminal. It listens until you click Stop monitoring or ccdeck exits, and starts again when ccdeck next starts on the same port.
Capture needs a permission once. On macOS, install Wireshark’s ChmodBPF helper. On Linux, give your user capture permission for
tcpdump. On Windows, install Wireshark with Npcap, with capture access for your user. ccdeck changes no permission itself.More about destinations
- The list holds your configured destinations that are IPv4 addresses. For a collector set by name, click Another IPv4 address… and type its address and port.
- It also offers the connections Claude Code has open, marked “telemetry unverified”.
- Up to eight destinations at once.
- Closing the dialog or the browser does not stop monitoring.
- Only whether monitoring is on and its destinations are saved, in
~/.agents-deck/radar-monitor-<port>.json; never packets or messages.
-
Read a message
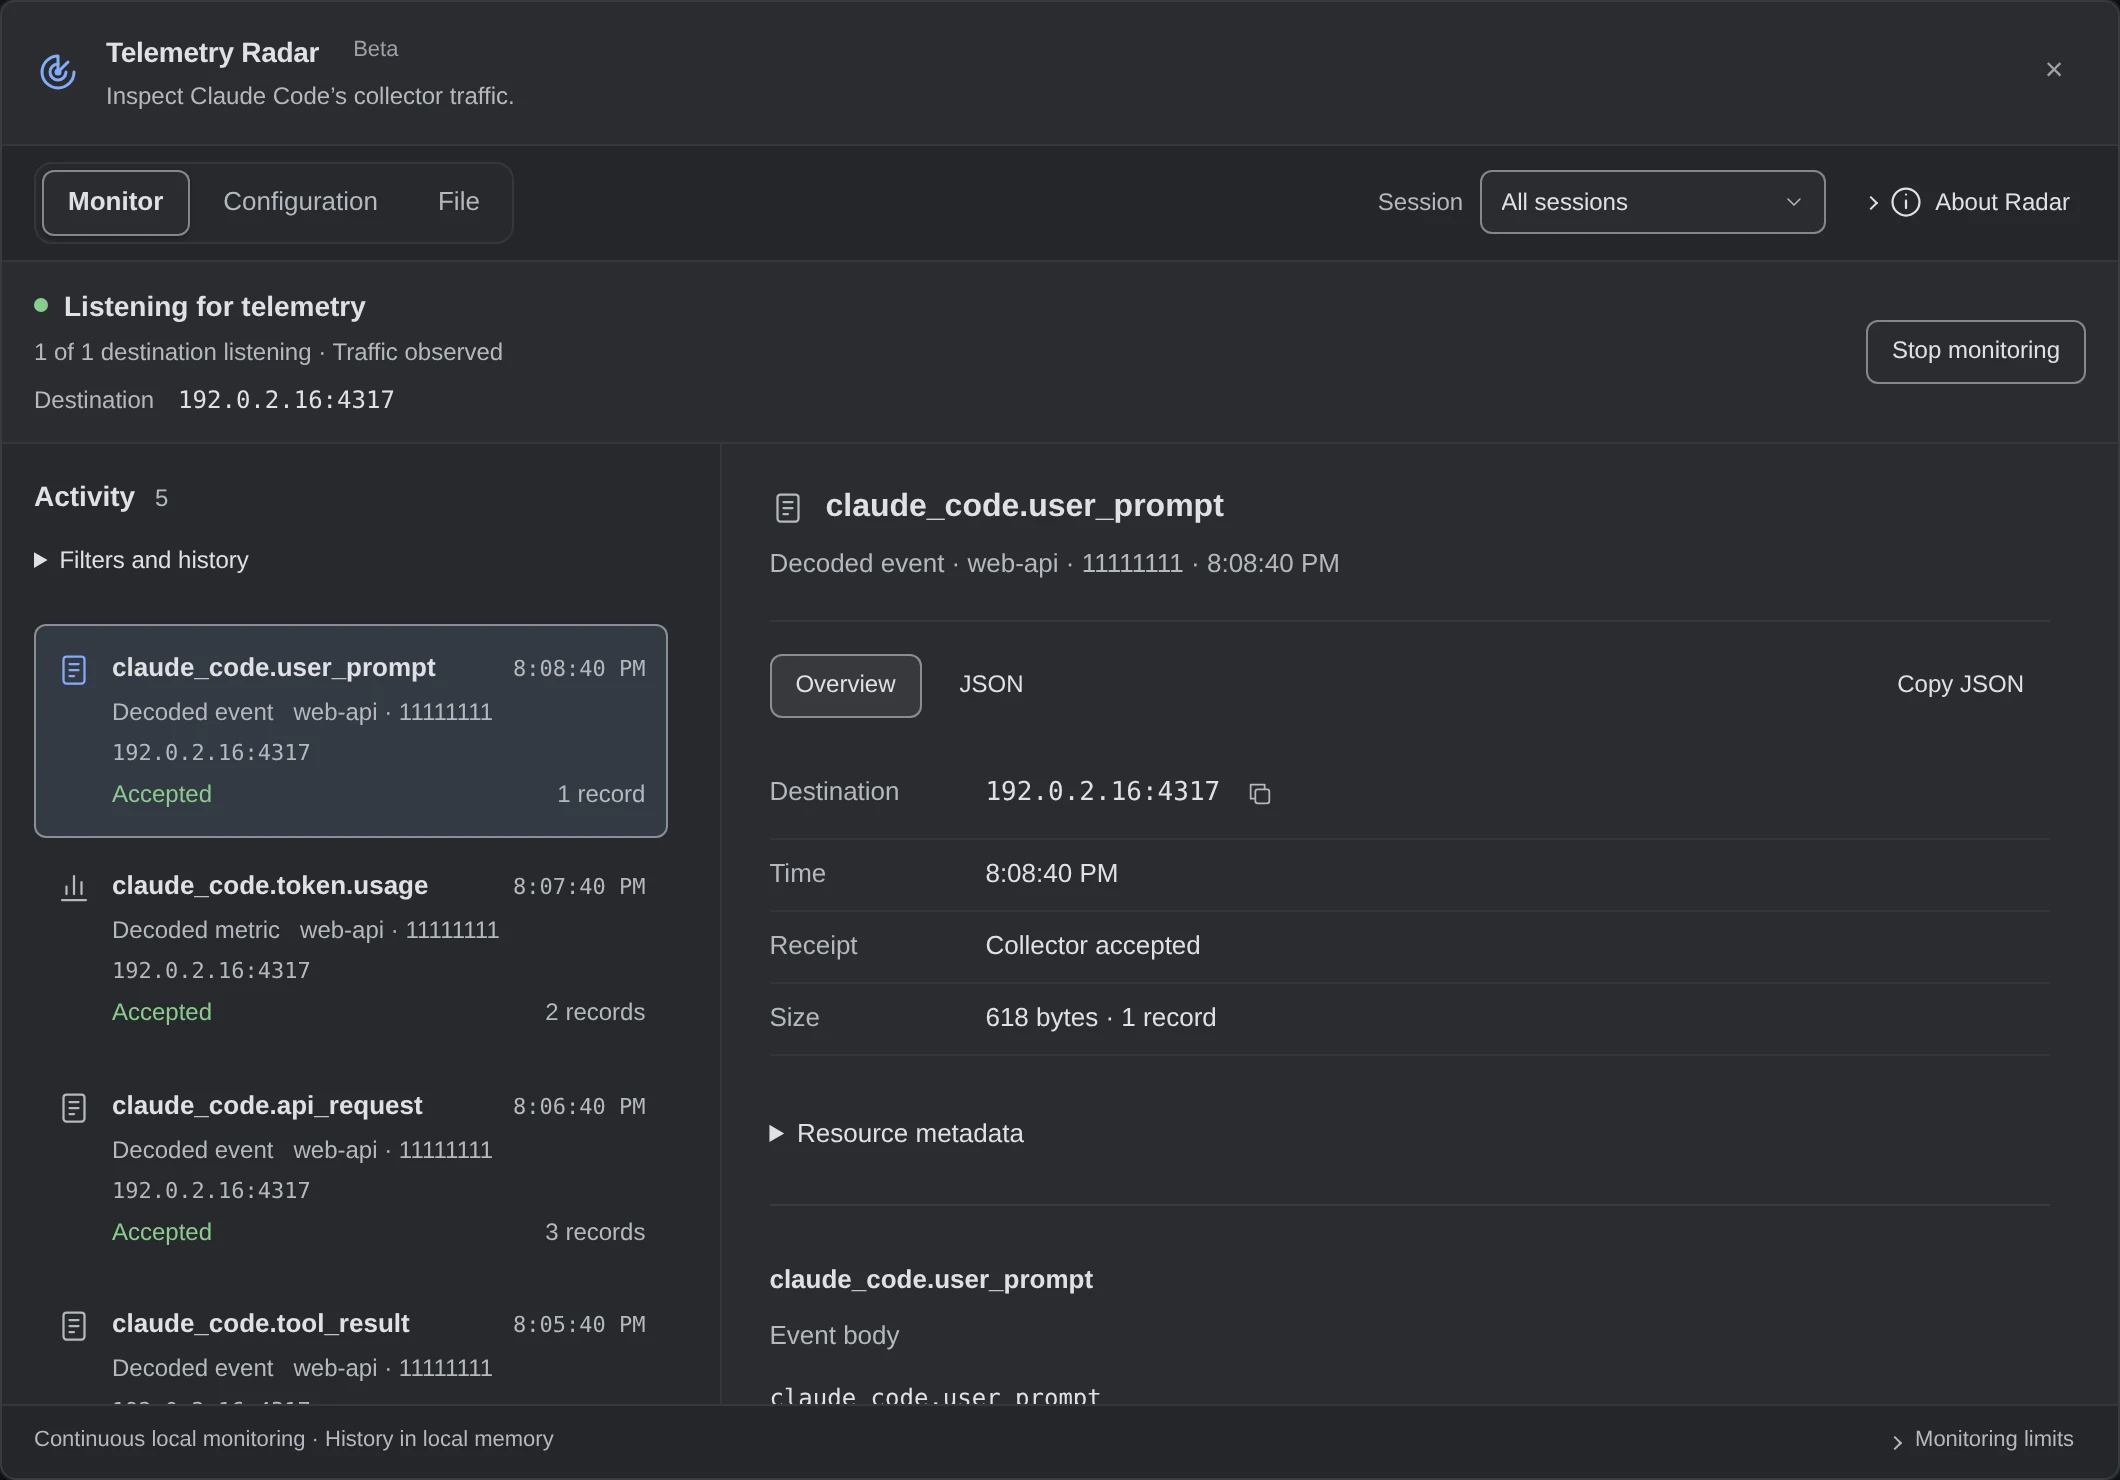
Each export Radar decodes is a row: its event or metric name, the session it came from, and whether the collector accepted it. Click a row. Overview shows its fields; JSON, the decoded export.
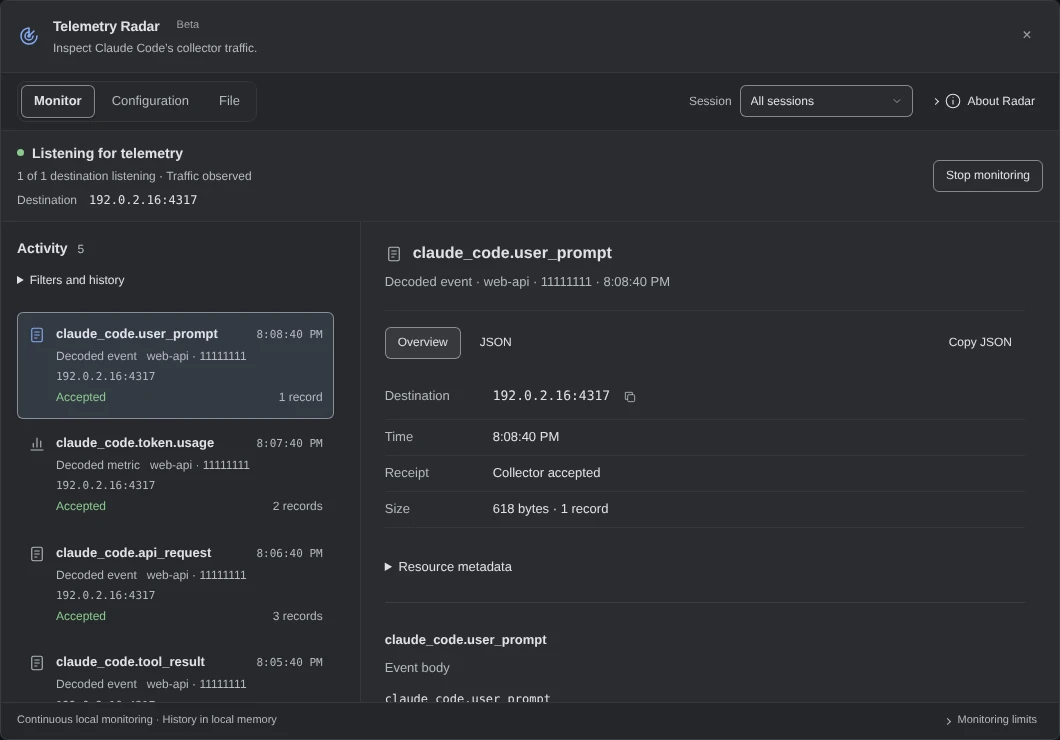 Open the full-size picture
Demo data 192.0.2.16 is an address reserved for examples. 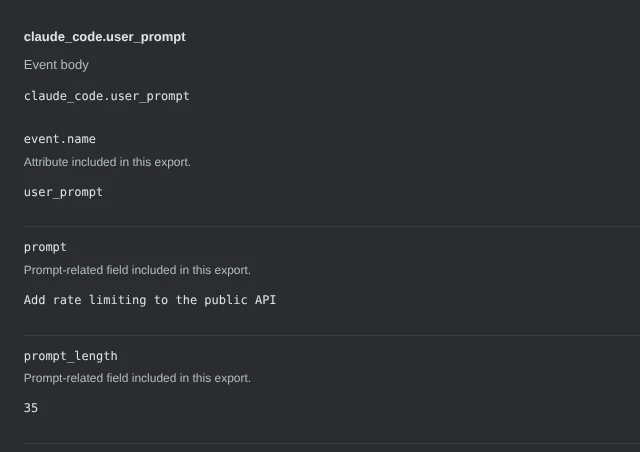
Demo data With Your prompts on, the prompt’s text is in the export. What Radar cannot show:
- Anything but OTLP over gRPC without TLS to an IPv4 address. An HTTPS export shows only as a connection it cannot read.
- Which program sent it: Radar filters by address, so another app sending there shows too.
- Claude Code’s requests to the model, and Anthropic’s own telemetry.
- Proof either way: a connection is not a sent message, and an empty list does not mean telemetry is off.
-
Stop, and clear what was captured
Click Stop monitoring. What Radar decoded stays in ccdeck’s memory, for 24 hours at most, and is never written to a file or sent anywhere. To remove it now, open Filters and history, click Clear history, then Confirm clear history. Restarting ccdeck removes it too.
If something goes wrong
“Install tcpdump” or “Install Wireshark with Npcap”
On Linux, install tcpdump, on the PATH of the user running ccdeck. On Windows, install Wireshark with Npcap. macOS ships tcpdump. Then click Start monitoring again.
Radar says Capture permission needed
Your user may not capture packets yet: see the note in step 4, or the Capture permission setup link in Radar. Radar retries by itself once access is there.
Monitoring, and nothing appears
Start a new Claude Code session: Radar decodes only connections that open while it listens, and flags apply to new sessions. If a row says Encrypted contents, the export uses TLS and cannot be read here.
Start monitoring is greyed out
No configured destination is an IPv4 address, or none is set. Pick Another IPv4 address… and type your collector’s, such as 192.0.2.16:4317.
A flag I switched is still set after uninstalling ccdeck
npx ccdeck --uninstall takes only ccdeck’s hooks out of ~/.claude/settings.json. Edit the flag under env in that file yourself.
Something else? See Troubleshoot ccdeck: status, logs, port and hooks.