See what your machine is doing while agents run
The This machine panel open beside the canvas: cores, memory, network and heat now, what each did since the deck started, and the busiest processes.
Before you start
- ccdeck running and open in a browser:
npx ccdeckopenshttp://127.0.0.1:4317, or the address it printed. Start ccdeck for the first time covers that. - Nothing to install for the panel. Temperatures need a sensor the computer will give up without administrator rights; step 4 says where they come from.
Steps
-
Open the panel
Click Machine in the topbar, or press S. On a window narrower than 1440 px the button shows only its chip icon; hover it for “Show this machine — cores, memory, temperature (S)”. The first time a browser opens the deck, the panel is already open.
The panel docks at the right edge, beside the canvas, and moves one place left while the Usage panel is open. Its title is This machine, followed by how long the computer has been up and how many cores it has. Under it come CPU, Load average, Memory, Network and Thermal, their headings in capitals, and at the foot Busiest processes. Network appears once the deck has read anything about the network, and Thermal only where the computer has a temperature sensor. Until the first reading arrives, the panel says “reading this machine…”.
When something needs attention, one line under the title says so, one thing at a time and in this order: the CPU held back to cool it, physical memory at 90% or more, or the Claude API not answering. On a quiet computer there is no line.
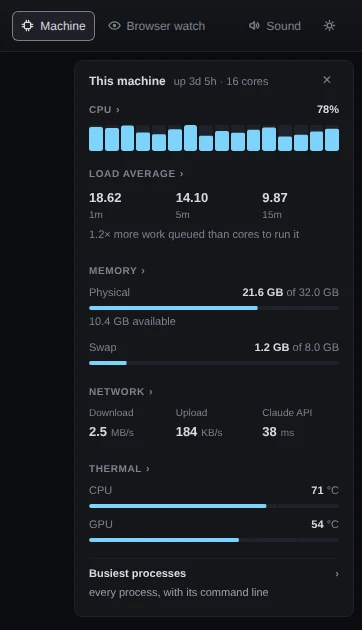
Demo data A 16-core Linux computer while the demo sessions run their tests. -
Read the CPU and the load
The figure beside CPU is how busy the whole computer is. The strip under it has one column per logical core; hover a column to read it, as in “logical core 7 · 100% busy”. The one figure cannot tell a little work on every core from one core stuck at 100%; the strip can. CPU is never coloured as a warning: at 90% the computer is doing the work you asked for.
Load average is the queue for the cores, averaged over one, five and fifteen minutes (1m, 5m, 15m): a count of tasks, not a share of the CPU. When the one-minute figure is above the core count, a line under it says by how much, as in 1.2× more work queued than cores to run it. Windows publishes no load average, so there the panel shows none.
-
Read the memory and the network
Physical is the memory in use out of the total, as in 21.6 GB of 32.0 GB, with what is still available under it. In use means the total less what the system can hand over without swapping, not the operating system’s own “used” figure. Sizes count in 1024s. The bar turns amber from 90%, and the line under the title then reads, for example, “physical memory 91% full”. Swap follows when the computer has any; on Windows the row is Commit, because that is what Windows reports.
Download and Upload are what every network interface on the computer is moving together, not one connection. They need two readings five seconds apart, and until then the section says “measuring…”. Claude API is how long a connection to Claude’s API takes to open; step 8 says what that sends. When the traffic goes through a VPN or Tailscale, a Connection details button under the figures names the route.
Claude Code only. The Claude API figure is measured only on a computer where the deck finds Claude Code. With Codex alone, the section shows Download and Upload.
-
Read the temperatures
Thermal is drawn only where the computer gives a reading. With no sensor there is no section at all, never a zero. Each row is named for what it measured, such as CPU, GPU or Thermal zone. Its bar ends at the temperature where the row turns red, with a notch where it turns amber; hover the row for its scale, as in “bar runs 0–100 °C · amber from 75 °C, red at 100 °C”. On an Intel Mac, a Throttling row says how much of the CPU’s speed is being held back to cool it, and while it is, the line under the title reads, for example, “throttled to 80% of full speed”.
Where the degrees come from:
- Linux:
/sys/class/hwmon, then/sys/class/thermal. - Windows: a performance counter, then
MSAcpi_ThermalZoneTemperature, then a hardware monitor you run yourself. - Mac with Intel:
ioregfor the GPU,pmsetfor throttling. - Mac with Apple silicon:
macmon, which the deck downloads when the Mac’s own sensors give nothing.
On Windows, that monitor is LibreHardwareMonitor with its web server on; the deck reads it and never installs it. On a Mac with Apple silicon, the deck keeps its copy of
macmonin~/.agents-deck/tools/macmon, and downloads nothing if you already havemacmonon your PATH or from Homebrew. - Linux:
-
Look back at a reading
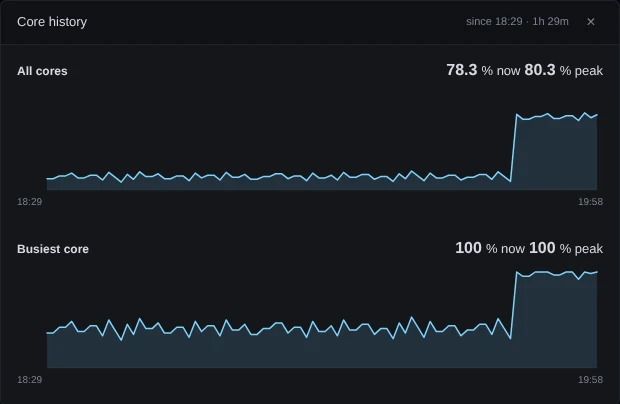
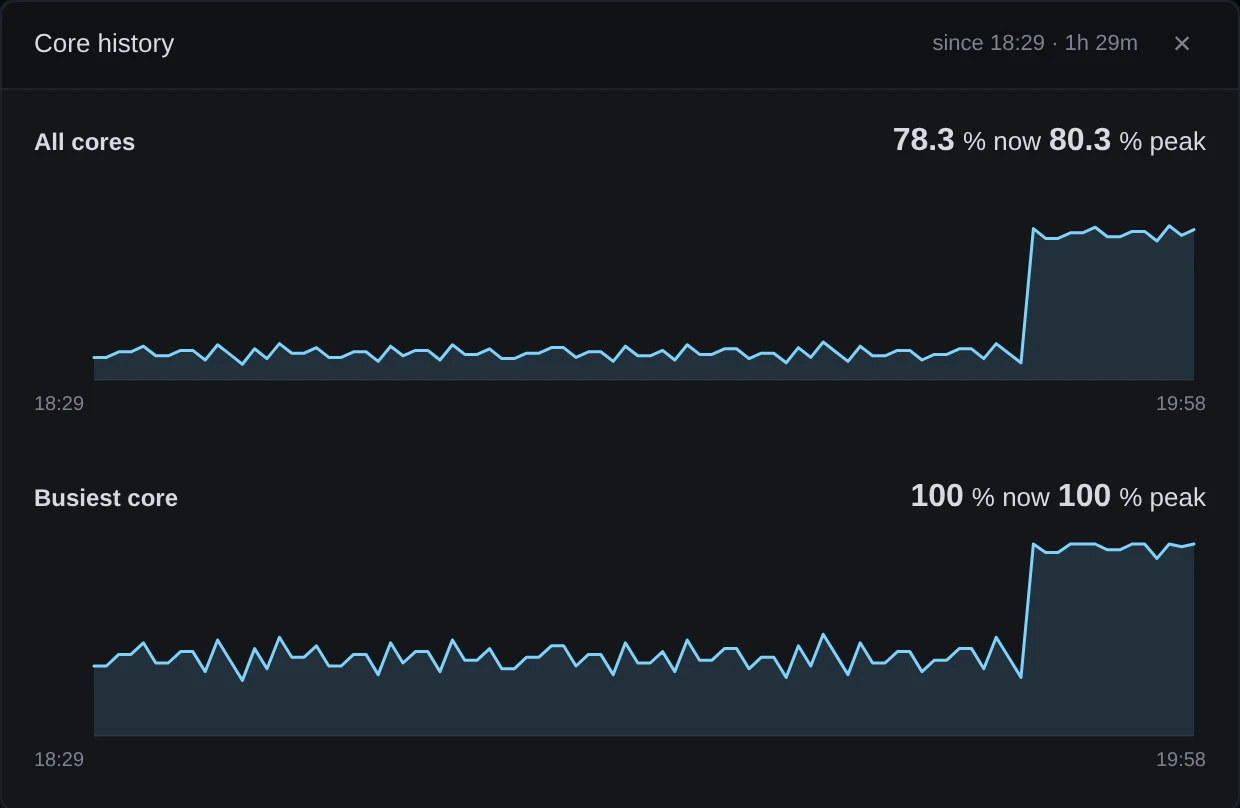
Each section’s heading and figures are one button, with a › after the heading. Click one to open its chart: Core history from the core strip, and Load history, Memory history, Network history or Thermal history from the others. The header says how far back the chart goes, as in since 18:29 · 1h 29m.
Each line shows its value now and its peak. Hover over a chart to read one minute. Dashed lines mark where a reading turns amber or red: memory and swap at 90%, the queue at your core count, each temperature at its own. The CPU and network charts have none.
 Open the full-size picture
Demo data The climb is the demo sessions starting their test run, and one core has been at 100% since. The deck keeps this history itself, whether or not the panel is open: one point per minute, holding that minute’s highest value, for up to a day. It is held in the deck’s memory, so it starts again when the deck restarts. Close the chart with its ×, with Esc, or by clicking outside it.
-
Find the busiest processes
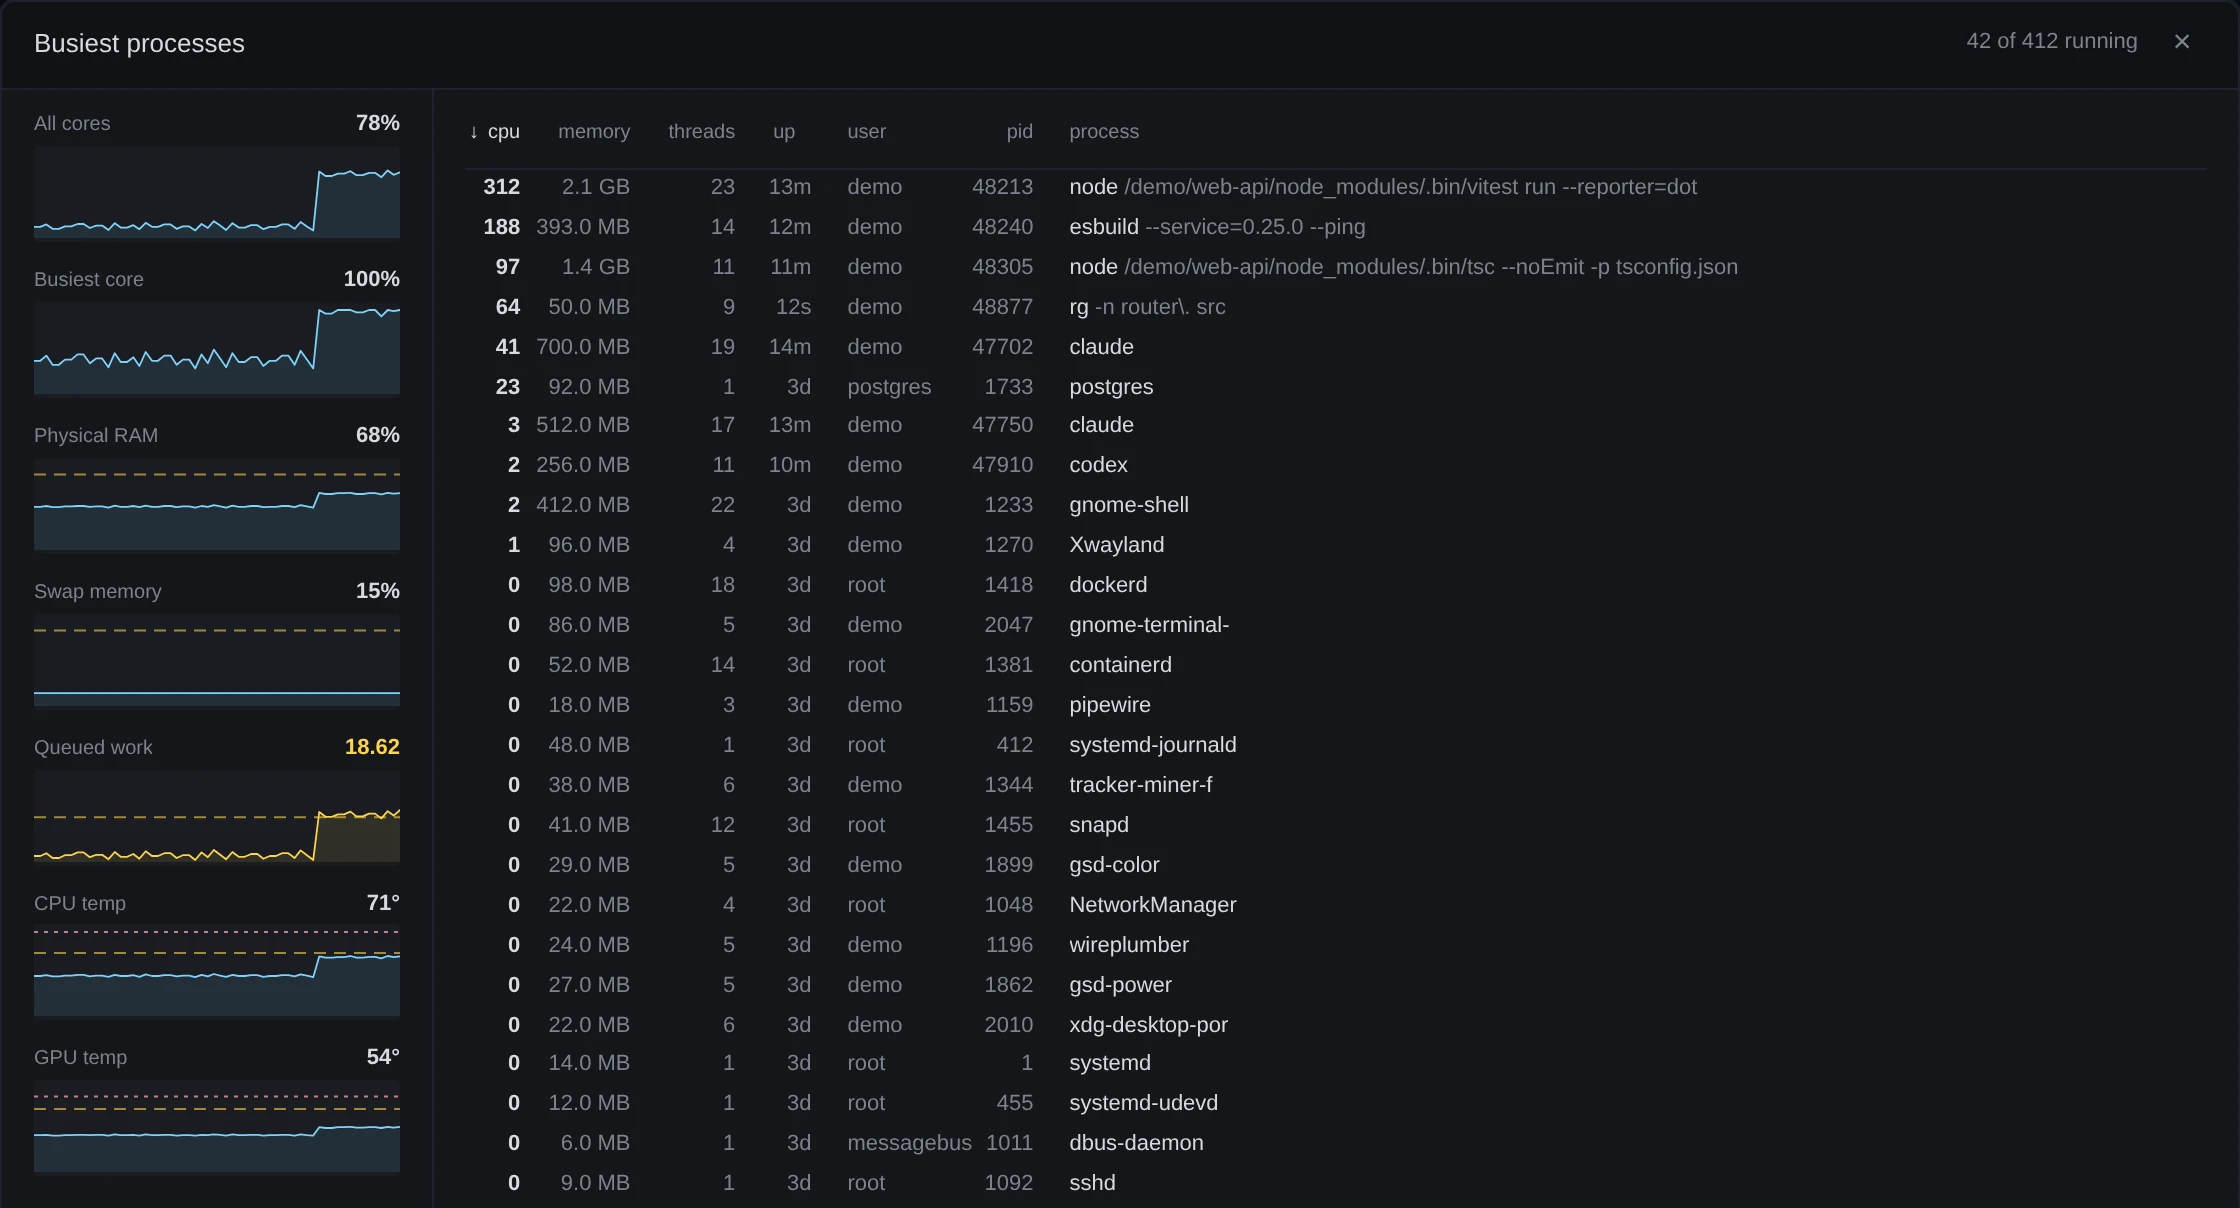
At the foot of the panel, click Busiest processes. The dialog of the same name lists the 40 busiest processes by CPU and the 40 largest by memory, not every process, and says how many of how many, as in 42 of 412 running. The line under the button reads “every process, with its command line”, but the dialog holds only those, as its count shows. It reads the list every 4 seconds while it is open, and never while it is shut.
The columns are cpu, memory, threads, up, user, pid and process. cpu is counted per core, so 312 is a little over three cores. memory is the resident size, which is what
psand Task Manager show; Activity Monitor on a Mac shows a different figure. After each name comes as much of its command line as tells twonodeprocesses apart, with anything shaped like a secret removed before it leaves the deck: a filter, not a guarantee, as that column’s tooltip says. The list starts sorted by cpu; click any heading but pid to sort by it, and click it again to reverse.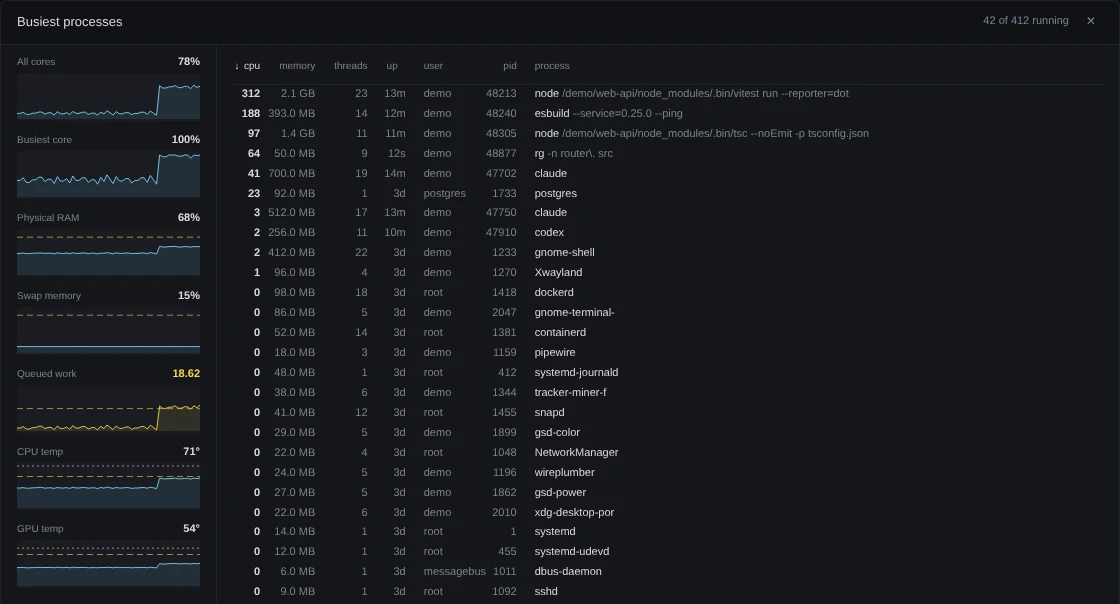 Open the full-size picture
Demo data The web-api session’s tests, bundler and type check are the three busiest, and the readings beside the list are the panel’s. On a window 1200 px wide or more, the computer’s readings sit beside the list, each with its last hour; on a narrower one they sit under it. There is no way to end a process here: that belongs to Activity Monitor, Task Manager or a terminal.
-
Close the panel
Click the × at its top right, click Machine again, or press S. Esc does not close it: that key belongs to the canvas, where it clears the selection. Clicking the canvas leaves the panel open too. Once closed, it stays closed in this browser until you open it again.
While the panel is open, the page asks the deck for a reading every 3 seconds. It stops when you close the panel or switch to another tab.
-
Know what leaves the computer
The deck reads every figure on this computer: the CPU and the load from Node, memory and swap from the operating system, temperatures from the sources in step 4, the network from the system’s own byte counters, and processes from
ps, orGet-Processon Windows, only while that dialog is open. It keeps the history in memory, writes none of it to disk, and serves the readings on127.0.0.1, which only this computer can reach. The panel shows this computer and no other.Two things do leave the computer:
- While the panel is open, and only where the deck finds Claude Code, the deck looks up
api.anthropic.comand opens a TCP connection to its port 443 about every 30 seconds, to time the Claude API figure. It closes the connection as soon as it opens and sends nothing over it, not even the start of an encrypted session. - On a Mac with Apple silicon whose sensors give nothing, the deck downloads
macmonfrom GitHub once and checks it against the checksum the release publishes.AGENTS_DECK_NO_DOWNLOAD=1orAGENTS_DECK_NO_INSTALL=1turns that off.
To name the route, the deck asks the computer’s routing table, and Tailscale when the route is a tunnel; both answers come from the computer itself. LibreHardwareMonitor is read over
127.0.0.1. - While the panel is open, and only where the deck finds Claude Code, the deck looks up
If something goes wrong
There is no Thermal section
The computer gave no temperature the deck can read without administrator rights. A virtual machine never does, and many Windows laptops do not. After three empty readings, within half a minute of starting, the deck stops asking until it restarts, and it never draws a zero in the section’s place.
On a Mac with Apple silicon, wait: the deck then downloads macmon once, and the section appears by itself. It does not download under AGENTS_DECK_NO_DOWNLOAD=1 or AGENTS_DECK_NO_INSTALL=1; install macmon yourself then, on your PATH or with Homebrew, and restart the deck. After installing any sensor tool or driver, restart the deck so that it asks again: npx ccdeck --stop, then npx ccdeck.
Windows shows no temperature
Many Windows computers, recent Intel laptops especially, declare no thermal zone that an ordinary program may read. The deck never asks for administrator rights and never installs a driver. If LibreHardwareMonitor runs with its web server on, the deck reads it from http://127.0.0.1:8085/data.json, or from the port in AGENTS_DECK_LHM_PORT. Start it before the deck, or restart the deck after starting it.
The deck also tries the performance counter under the name a translated Windows gives it. That path has not been tested on a translated Windows.
The panel says “reading this machine…” and nothing else
The CPU figure needs two samples 3 seconds apart, so a deck that has just started has none yet. Wait a few seconds. If the sentence stays, the page is not getting answers from the deck: run npx ccdeck --status to see whether it is running.
Network says “Can’t reach Claude”
The connection to api.anthropic.com failed, or took longer than 4 seconds. The line under the title may say “the Claude API is not answering” as well. Check your connection or VPN. If the traffic goes through a tunnel, Connection details names it.
Busiest processes says “Could not read the process list on this platform.”
ps, or Get-Process on Windows, failed or returned nothing. The dialog asks again every 4 seconds; on Windows the first PowerShell start can take a reading or two.
On Windows, cpu shows — and there is no user or command line
Windows reports CPU time, not a rate, so the first reading has no percentage; it appears at the next one, 4 seconds later. The deck reads no user and no command line on Windows.
S does nothing
Letter keys are ignored while a text field has the focus and while any dialog is open, such as Busiest processes or a history chart. Press Esc or close the dialog, then press S, or click Machine in the topbar.